


Lessons from Alchemy and Chaos Theory: Part II
Continuing our series of Robin Robertson’s “Lessons from Alchemy and Chaos Theory”, it is now time to be introduced to fractals.
by Robin Robertson
Part Two: Fractals
I believe that scientific knowledge has fractal properties, that no matter how much we learn,
whatever is left, however small it may seem, is just as infinitely complex, as the whole was to
start with. That, I think, is the secret of the Universe.
- Isaac Asimov1
The term fractal was invented by Benoit Mandelbrot, who created the whole field of fractal
mathematics. One of many definitions of fractal is that a fractal is a complex geometric figure whose
small-scale and large-scale structures resemble one another.

The most famous traditional attempt to portray this quality is the Taijitu, the classic Yin Yang symbol: This symbol represents the unity of yin and yang,
where each contains the other. The small dots inside each half portray this containment. But, by implication, there is no end to this process: the yin within the yang in turn contains both yin and yang, and the process continues endlessly.
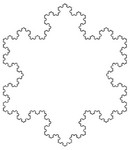
Mathematics had many such unusual geometric figures, which predated Mandelbrot’s discovery of fractals. For example, in a 1904 paper, the Swedish mathematician Helge von Koch presented what has come to be known as the Koch snowflake. Take an equilateral triangle (i.e., each side is the same size. Then divide each side into thirds and on the middle third build another equilateral triangle. Continue this process with those triangles, and with all subsequent triangles. The figure on the left below shows this process progressing through four stages. The figure on the right shows the result after eight stages.
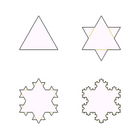
A closely related figure is the Sierpinski triangle, described by mathematician Waclaw Sierpinski in 1916. In this case, take another equilateral triangle, but this time, divide it into 4 equilateral triangles and remove the middle one. Continue this process with all the triangles that emerges. Or instead of a triangle, take a square, divide it into smaller squares and remove the middle ones. Again the process continues. The process can be used just as readily on 3-dimensional objects or even higher dimensional objects, though of course we can no longer see what those look like. The most famous of the 3- dimensional objects is the Sierpinski cube. Here are pictures of the Sierpinski triangle, square, and cube.


Until Mandelbrot, however, these strange figures were considered anomalous, or even “pathological.” Mandelbrot broke the ice with a three page paper that somehow slipped into the illustrious (and usually staid) pages of Science in 1967, called “How long is the coast of Britain?”2 This paper has become known not only to mathematicians, but to the general public as well, usually for the wrong reason. Reference books often give figures for the length of the coast line of various countries. But it’s self-evident that the length depends on the measuring device. If a ruler is used instead of a yardstick, the coast line will be much longer, because the yard stick can measure smaller differences in its shape. If we let the unit of measure get smaller and smaller, ultimately the length of any coast would
be infinite. That’s what most people think Mandelbrot’s paper was about.
Actually he had discovered something quite different. He had come across a 1961 paper by Lewis Fry Richardson, who Mandelbrot later referred to as “a great scientist whose originality mixed with eccentricity.”3 Richardson had found that the approximate length of a variety of actual coast lines could be calculated by a simple formula into which you plugged the length of measurement you were using. The formula had a constant “D” that varied by the coast line.4 So for the coast line of Spain, there
was one “D”, and another for “Britain,” and so forth. This was exactly what Mandelbrot meant by fractal (though he hadn’t yet come up with the word yet). Mandelbrot’s breakthrough was to recognize that this constant “D” was actually a dimension, even though it wasn’t a whole number. In other words, in addition to the 1-dimension of a straight line, the 2-dimensions of drawings on a plane, the 3-dimensions of solid objects, etc., he was proposing that there could be fractional dimensions. For example, in the paper, heproposes that the dimension of the west coast of Britain is approximately 1.25.
We needn’t be concerned with the math here. What is significant is that the math produced figures which were self-similar no matter what level you looked at them. By 1973, Mandelbrot was working for IBM as a fellow at the Thomas J. Watson research center, and had access to high-speed computers. This was like a Disneyland for Mandelbrot. He worked out formulas which, when fed back into themselves over and over (as with everything else in chaos theory), produced coast lines that actually looked like real coast lines. Mandelbrot went on to generate clouds and trees and rivers and almost anything else imaginable in nature. The implication was that, since he could generate something that looked remarkably like a natural phenomena by building it up out of little self-similar pieces, then nature itself might use the same technique. Nature might be fractal. Or, as the Emerald Tablet had it: “as above, so below.”
The most famous of all fractal creations is the Mandelbrot set, which is the most complex mathematical object in existence. As with all the earlier fractals, it’s generated from a very simple formula5 with the results fed back over and over again. It’s normally generated using colors to show distinctions, but a beautiful black and white version follows, created by mathematician Ed Pegg, Jr. The shadings in color between black and white were generated by the average differences between iterations.
Again imagine that you had an enormously powerful microscope which you could use to look at
any part of this figure. If you would do so, you’d find that what you saw would look remarkably like the
whole picture you’re seeing. What makes this more interesting than the fractal objects you’ve seen earlier
in this chapter is that you would find creative differences between the original figure and its copies at
each deeper level. These approximations to the original look very similar, but each has variations of its
own, as if some celestial artist kept working with it at every level. The new insight that chaos theory and
fractals give on the ancient idea of “as above, so below” is that there may be beautiful variations on
theme that emerge without any way of predicting what they will be.
Notes:
1. Asimov, Isaac, I, Asimov: A Memoir, New York, Bantam, 1995. Quoted in Clifford A.
Pickover, A Passion for Mathematics. (Hoboken, New Jersey: John Wiley & Sons, 2005), p. 90.
2. Mandelbrot, Benoit, “How long is the coast of Britain?”. Science 156, pp. 636-638.
3. Mandelbrot, Benoit. The Fractal Geometry of Nature. (New York: W. H. Freeman & Co.,
1977), p. 29.
4. The actual formula was L(€) ˜ F€1-D.
5. Zn+1=Zn+c, where c is a complex number; that is, a number with both a real and an imaginary
component.
